e.l.f. Beauty — LONG
April 14, 2026
Mario Molinari · Apollo Investment Club
Ticker: ELF | Exchange: NYSE | Sector: Consumer Discretionary / Beauty & Personal Care
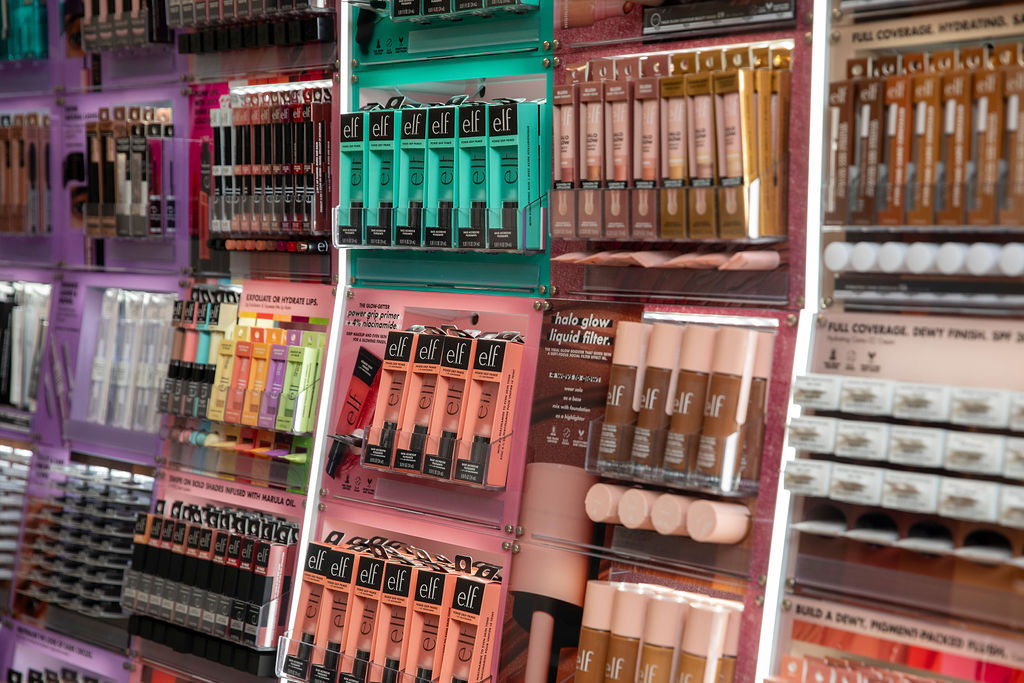
- ☐High-growth, digitally native cosmetics brand
- ☐Focus is on affordable, but high-quality beauty products
- ☐Retail presence in 14 countries, with additional global distribution via eShopWorld
- ☐Operates with an asset-light, outsourced manufacturing model
- ☐Key Categories are Face (foundation, concealer), Eyes (mascara, eyeliner), and Lips (lipstick, gloss)
Source: 1e.l.f. Beauty, Inc., 2026
- Brand Power and Innovation: Portfolio includes e.l.f. Cosmetics, e.l.f. SKIN, Naturium, Well People, Keys Soulcare, and Rhode by Hailey Bieber.
- Financial Performance and Growth: Net sales increased significantly over the past three years. One of only 6 companies to grow for 28 consecutive quarters.
- Dependence on Third-Party Relationships: Relies heavily on third-party suppliers, manufacturers, and distributors. Limited retailer concentration creates vulnerability.
- International Business Uncertainties: Significant operations in China expose the company to geopolitical tensions, trade policies, and economic fluctuations.
- Strategic Acquisitions and Expansion: The rhode acquisition expands the brand portfolio into premium skincare. Successful Naturium integration positions e.l.f. to leverage cross-brand synergies and drive further growth.
- Intense Industry Competition: The beauty industry is highly competitive, with large multinational companies and emerging independent brands vying for market share.
Source: GuruFocus, 2025
- Brand
- #1 most purchased cosmetics brand for Gen Alpha, Gen Z, and Millennials
- Cost Advantage
- They operate with a low-cost model (outsourced manufacturing).
Source: e.l.f. Beauty, Inc., 2026
- e.l.f. Beauty currently trades at ~37.1x TTM P/E, significantly below historical peak multiples (~100x+), and at ~19.1x EV/EBITDA, significantly below historical peak multiples (~60x+), suggesting multiple compression despite sustained earnings growth.
- Forward P/E is at ~17.73, showing undervaluation compared to company's history, despite continued growth
Source: Yahoo Finance
- Strong demand for low-priced cosmetics even in weaker macro environments
- If consumers trade down from prestige brands, e.l.f takes their market share
| Product | e.l.f. Price | Prestige Price | Difference (Savings) |
|---|---|---|---|
| Power Grip Primer | $11 | $38 | $27 |
| Lip Oil / Gloss | $9 | $40 | $31 |
| Halo Glow Skin Tint | $18 | $48 | $30 |
| Vitamin C + E Serum | $17 | $185 | $168 |
Source: e.l.f. Beauty, Inc., 2026
- Early adopter of emerging platforms (TikTok, Twitch, BeReal, TikTok Shop) → meets consumers where they are
- Blends commerce + entertainment (example: live shopping on Twitch) to drive engagement and sales
- Relies heavily on bold, viral influencer campaigns with creators, celebrities, and unexpected partnerships
- Builds long-term brand loyalty through transparency, engagement, and interaction
Source: CommerceNext
- #1 most purchased cosmetics brand for GenAlpha, Gen Z, and Millennials
Source: e.l.f. Beauty, Inc., 2026; Statista
- My theory that beauty / "female-focused" companies are often overlooked by the market
- Wealth Management / Financial Advising → 70-77% men
- Hedge Funds → 90-99% men
- Investment Banking → 60-70% men
- Individual Investors → 60-70% men
- This demographic skew may contribute to underappreciation of demand trends in female-focused categories, leading to potential mispricing.
Source: OpenAI. (2026)
- Generate revenue through direct sale of cosmetics and skincare products
- High volume, low price → mass-market scalability
- Retail Distribution (Target, Walmart, Ulta, etc.) and Direct-to-consumer (DTC) / e-commerce (elfcosmetics.com, TikTok Shop, etc.)
Source: Statista
- Revenue of the cosmetics industry worldwide was ~$108.97B in 2024 and is expected to be ~$139.29B by 2030
- Revenue of the skin care industry worldwide was ~$190.27B in 2024 and is expected to be ~$235.96B by 2030
Source: e.l.f. Beauty CAGNY 2026 Presentation; Statista
- e.l.f. has ~4x market share expansion since 2018
- e.l.f. growing way faster than serviceable addressable market
| REVENUE in billion USD (US$) | 2018 | 2019 | 2020 | 2021 | 2022 | 2023 | 2024 | 2025 | estimates start → 2026 | 2027 | 2028 | 2029 | 2030 | 2031 |
|---|---|---|---|---|---|---|---|---|---|---|---|---|---|---|
| Total Beauty and Cosmetics Category Revenue | 550.43 | 559.32 | 530.76 | 559.69 | 581.87 | 626.89 | 651.49 | 674.94 | 698.38 | 721.85 | 745.32 | 768.81 | 792.29 | 815.78 |
| Beauty Tech Revenue | 6.92 | 7.23 | 9.51 | 8.46 | 7.88 | 8.22 | 8.56 | 8.96 | 9.35 | 9.75 | 10.15 | 10.55 | 10.95 | 11.34 |
| Skin Care Revenue | 160.02 | 163.77 | 158.44 | 164.35 | 168.61 | 182.80 | 190.25 | 197.13 | 204.00 | 210.90 | 217.79 | 224.69 | 231.59 | 238.49 |
| Personal Care Revenue | 242.83 | 245.15 | 243.91 | 255.56 | 258.88 | 274.23 | 283.85 | 293.41 | 302.98 | 312.55 | 322.12 | 331.70 | 341.28 | 350.86 |
| Cosmetics Revenue | 87.58 | 89.88 | 72.37 | 80.74 | 93.05 | 103.73 | 108.96 | 113.50 | 118.04 | 122.58 | 127.12 | 131.66 | 136.20 | 140.73 |
| Fragrances Revenue | 53.08 | 53.28 | 46.54 | 50.58 | 53.44 | 57.91 | 59.88 | 61.94 | 64.01 | 66.07 | 68.14 | 70.21 | 72.28 | 74.35 |
| e.l.f. Serviceable Addressable Market (Skin Care + Cosmetics) Revenue | 247.60 | 253.65 | 230.81 | 245.09 | 261.66 | 286.53 | 299.21 | 310.63 | 322.04 | 333.48 | 344.91 | 356.35 | 367.79 | 379.22 |
| e.l.f. Serviceable Addressable Market (Skin Care + Cosmetics) Revenue y.o.y. growth | -- | 2.44% | -9.00% | 6.19% | 6.76% | 9.50% | 4.43% | 3.82% | 3.67% | 3.55% | 3.43% | 3.32% | 3.21% | 3.11% |
| e.l.f Revenue | 0.27 | -- | 0.28 | 0.32 | 0.39 | 0.58 | 1.02 | 1.31 | 1.64 | 1.97 | 2.27 | 2.54 | 2.82 | 3.10 |
| e.l.f. Revenue y.o.y. growth | -- | -- | -- | 12.37% | 23.27% | 47.70% | 76.86% | 28.32% | 25% | 20% | 15% | 12% | 11% | 10% |
| e.l.f. % of Total Skin Care / Cosmetics Revenue | 0.11% | -- | 0.12% | 0.13% | 0.15% | 0.20% | 0.34% | 0.42% | 0.51% | 0.59% | 0.66% | 0.72% | 0.77% | 0.81% |
| e.l.f. % of Total Skin Care / Cosmetics Revenue growth y.o.y | -- | -- | -- | 5.82% | 15.46% | 34.88% | 69.36% | 23.60% | 20.56% | 15.69% | 11.86% | 9.09% | 6.94% | 5.19% |
| statista + e.l.f. beauty | ||||||||||||||
Source: e.l.f. Beauty CAGNY 2026 Presentation; Statista
| Line Item | Amount | % of Revenue |
|---|---|---|
| Revenue (TTM) | $1,519.8M | 100.00% |
| Cost of Goods Sold (COGS) | ($451.9M) | |
| Gross Profit | $1,067.9M | 70.27% |
| Operating Expenses (OpEx) | ($899.7M) | |
| Operating Income | $168.3M | 11.07% |
| Net Income | $103.9M | 6.84% |
- Revenue (TTM): $1.52B
- Gross Margin: 70.27% – Strong pricing power & efficient sourcing/manufacturing
- Operating Margin: 11.07% – Mature beauty companies are ~15-25%, but this is due to growth reinvestment, so it is not structural weakness
- Net Margin: 6.84% – early/mid-stage profitability profile, room to grow
- $0.70 remains after cost of goods
- $0.11 remains after operating expenses
- $0.07 becomes net profit
Source: e.l.f. Beauty, Inc. (2025). Form 10-K
- e.l.f. operates with a solid gross margin (~70%)
- However, operating margin is still developing (~11%)
- This reflects:
- Heavy marketing + growth reinvestment
- DTC + digital spend
- e.l.f. prioritizes growth over near-term profitability
| Company | Gross Margin | Operating Margin | Net Margin |
|---|---|---|---|
| e.l.f. Beauty | 70% | 11% | 7% |
| Estée Lauder | 75% | 5% | -1.21% |
| L'Oréal | 74% | 19% | 13% |
| Coty | 64% | 3% | -9% |
| Median | 72% | 8% | 2.9% |
Source: Finviz
- e.l.f. is the #1 unit share brand and the #2 dollar share brand in beauty
- Besides e.l.f. brands, there are 14 cosmetics brands that have >$200M in retail sales, e.l.f. has 4 brands that have surpassed this amount
- e.l.f.
- Rhode
- Naturium
- e.l.f. skin
- e.l.f. is the #1 cosmetics brand by unit share, #11 skin brand by market share, and their brand Naturium is the #11 masstige brand
- e.l.f. has the #1 brand at Sephora (Rhode), the #1 body was at Ulta (Naturium), and e.l.f. Primer is the #1 sku in cosmetics in general
Source: e.l.f. Beauty, Inc., 2026
- As of May 26th 2025, e.l.f. Cosmetics and e.l.f. SKIN products will be available in 776 Kruidvat and 183 Trekpleister stores in The Netherlands and 271 Kruidvat stores in Belgium.
- As of September 2024 the following additions were made
- Germany: As previously announced, e.l.f. is expanding in Germany in 1,600 ROSSMANN locations nationwide.
- U.K.: in 2024 e.l.f. Cosmetics was the No. 4 mass makeup brand as compared to No. 8 in 2023
- Mexico: e.l.f. debuted in dozens of Sephora Mexico locations in fall 2024, marking its re-entry in the country and its first time with Sephora Mexico.
- Australia: e.l.f. expanded its existing distributor relationship in Australia by launching in Coles and expanded its presence in Priceline.
- Italy: e.l.f. Cosmetics entered Douglas in fall 2023 as the No. 1 makeup brand across mass and prestige in all existing doors and has stayed there. They also doubled current store space by expanding into hundreds of additional Douglas locations this fall and will launch on Amazon this fall.
- Netherlands: e.l.f. Cosmetics has maintained dominance in Etos since launch in April 2024.
- Canada: e.l.f. Cosmetics rose from No. 4 mass makeup brand, up from No. 6 in 2023.
Source: e.l.f. Beauty inc., 2025; e.l.f. Beauty Inc. 2024
- Growth has been primarily driven by volume rather than price increases
- e.l.f.'s has a value-first positioning
Source: e.l.f. Beauty, Inc., 2026
- Margins peaked near ~19–20% in 2023, followed by normalization
- Recent compression reflects increased investment in marketing and growth initiatives
Source: MacroTrends
- e.l.f. has shown strong improvement in ROIC, rising from ~3% in 2021 to a peak of ~22% in 2024
- Recent normalization to ~10% reflects increased reinvestment to support growth
- High ROIC has been driven by:
- Asset-light business model (outsourced manufacturing)
- High gross margins (~70%)
- Efficient working capital management
- Continued growth and scale should support future ROIC expansion
Source: GuruFocus
- e.l.f. raised its 2026 outlook, with net sales expected at $1.60–$1.61B (+22–23% YoY)
- Adjusted EBITDA guidance increased to $323–$326M, implying continued strong profitability
- EPS guidance raised to $3.05–$3.10, reflecting earnings growth despite reinvestment
| Metric | FY2025 Actual | Previous Outlook (Low) | Previous Outlook (High) | Current Outlook (Low) | Current Outlook (High) | YoY Growth |
|---|---|---|---|---|---|---|
| Net Sales | $1,303.8M | $1,540M | $1,560M | $1,600M | $1,610M | +22–23% |
| Adjusted Gross Margin | ~71% | ~70% | ~71% | ~71% | ~72% | Stable |
| Adjusted EBITDA | $242M | $302M | $306M | $323M | $326M | ~20% margin |
| Adjusted EBITDA Margin | ~18.6% | ~19.6% | ~19.6% | ~20.2% | ~20.2% | Expanding |
| Adjusted EPS | $3.41 | $2.90 | $2.95 | $3.05 | $3.10 | Raised |
| Capital Expenditures | ~$18.5M | ~$20M | ~$25M | ~$20M | ~$25M | Stable |
Source: e.l.f. Beauty Inc., 2025
- e.l.f. has experienced a significant inflection in free cash flow since 2022
- FCF has scaled rapidly to $100M+ levels in recent years
- Business demonstrates strong cash conversion from earnings
- Recent performance highlights operating leverage as the company scales
Source: MacroTrends
- e.l.f. operates a capital-light business model, with capex remaining minimal
- Capex is significantly below depreciation, indicating limited reinvestment needs
| Line Item | FY2025 | FY2024 | FY2023 |
|---|---|---|---|
| Depreciation & Amortization (D&A) | $44.1M | $30.2M | $17.6M |
| Capital Expenditures (CapEx) | ($18.5M) | ($8.7M) | ($1.7M) |
| CapEx as % of D&A | 42% | 29% | 10% |
| CapEx as % of Revenue | 1.4% | 0.8% | 0.2% |
Source: e.l.f Beauty Inc., 2025
- Multiple peaked above 200x in early stages, driven by low earnings base
- P/E has normalized into a ~30–100x range as earnings scaled
- Recent compression to ~30–40x levels
Source: MacroTrends
- e.l.f.'s EV/EBITDA multiple has shown significant volatility, driven by shifts in growth expectations
- Multiple expanded to ~60x in 2024, reflecting peak growth and strong investor sentiment
- Recent compression to ~18x levels represents a substantial normalization
Source: GuruFocus
- e.l.f. trading at 17.4x forward P/E, in line with prestige beauty median of 15.0x
- e.l.f. EV/EBITDA of 18.9x reflects premium valuation relative to broader beauty peer median of 10.5x
- Valuation supported by superior growth profile and market position vs. historical peers
| Company | Price | MCAP | Net Debt | Ent Value | P/E | Fwd P/E | EV/EBITDA TTM |
|---|---|---|---|---|---|---|---|
| ESTÉE LAUDER | $73.29 | $26,510 | $4,396 | $30,906 | -- | 24.4x | 15.0x |
| COTY | $2.09 | $1,840 | $3,702 | $5,542 | -- | 5.7x | 6.2x |
| MEDIAN | -- | 15.0x | 10.6x |
| Company | Price | MCAP | Net Debt | Ent Value | P/E | Fwd P/E | EV/EBITDA TTM |
|---|---|---|---|---|---|---|---|
| ULTA BEAUTY | $532.79 | $23,300 | $1,688 | $24,988 | 20.8x | 16.9x | 13.5x |
| ODDITY TECH | $13.82 | $783 | $182 | $965 | 7.7x | 9.2x | 7.6x |
| HONEST COMPANY | $2.87 | $323 | -- | $323 | -- | 19.1x | -- |
| MEDIAN | 14.2x | 16.9x | 10.5x |
| Company | Price | MCAP | Net Debt | Ent Value | P/E | Fwd P/E | EV/EBITDA TTM |
|---|---|---|---|---|---|---|---|
| e.l.f. Beauty | $63.93 | $3,780 | $108 | $3,888 | 36.13 | 17.4x | 18.9x |
Source: GuruFocus; FinanceCharts; Yahoo Finance. As of April 14, 2026.
| Year 1 | Year 2 | Year 3 | Year 4 | Year 5 | |
|---|---|---|---|---|---|
| Fiscal Year | FY2026E | FY2027E | FY2028E | FY2029E | FY2030E |
| Unlevered Free Cash Flow | $186,782 | $252,766 | $333,994 | $412,218 | $486,806 |
| Discount Period | 1 | 2 | 3 | 4 | 5 |
| Discount Factor | 0.8950 | 0.8011 | 0.7170 | 0.6417 | 0.5744 |
| Present Value of UFCF | $167,177 | $202,489 | $239,476 | $264,540 | $279,616 |
| Terminal Year UFCF (Year 5) | $486,806 |
| Terminal Growth Rate | 3.5% |
| WACC | 11.7% |
| Terminal Value (Gordon Growth) | $6,124,146 |
| PV of Terminal Value | $3,517,640 |
| Sum of PV of UFCFs | $1,153,298 |
| PV of Terminal Value | $3,517,640 |
| Enterprise Value | $4,670,938 |
| Enterprise Value | $4,670,938 |
| Less: Total Debt | $313,018 |
| Plus: Cash & Equivalents | $148,692 |
| Equity Value | $4,506,612 |
| Diluted Shares Outstanding (M) | 59.05 |
| Implied Share Price | $76.32 |
| Current Share Price | $68.80 |
| Upside / (Downside) | 10.9% |
| Value | % | |
|---|---|---|
| PV of Projected FCFs | $1,153,298 | 24.7% |
| PV of Terminal Value | $3,517,640 | 75.3% |
| Total Enterprise Value | $4,670,938 | 100.0% |
- DCF values e.l.f. Beauty at an implied share price of $76.32, representing 10.9% upside from the current price of $68.80.
- The valuation is driven by continued strong revenue growth, operating leverage from scale, and consistent free cash flow generation.
- We assume a WACC of 11.7% and a terminal growth rate of 3.5%, which are conservative and in line with long-term industry expectations.
- Approximately 75.3% of enterprise value is derived from terminal value, reflecting the company's extended growth runway but also highlighting sensitivity to long-term assumptions.
- The model demonstrates significant FCF growth from $187M in FY2026E to $487M by FY2030E, supporting the valuation thesis.
| WACC | 11.7% |
| Terminal Growth Rate | 3.5% |
| % of EV from Terminal Value | 75.3% |
| Current Price | $68.80 |
| Upside to Implied Price | +10.9% |
Source: Author's DCF model; e.l.f. Beauty, Inc. Form 10-K (2025); Yahoo Finance. As of April 14, 2026.
- Scenario analysis values e.l.f. Beauty between $50.35 (bear) and $137.37 (bull), with a base case of $76.32, implying approximately 11% upside from the current price of $68.80.
Source: Author's analysis; Yahoo Finance; GuruFocus. As of April 14, 2026.
- At the current price of $64.49, e.l.f. Beauty offers a compelling risk/reward profile, with ~18% base case upside and >100% upside in a bull scenario.
- Downside appears relatively limited (~22%) in the bear case, supported by strong brand equity, profitability, and continued demand for affordable beauty products.
Source: Author's analysis. Current price: $64.49. As of April 14, 2026.
- Fast-growing company with strong momentum
- Beauty category CAGR past 10 years → +4%
- e.l.f. Beauty CAGR past 10 years → +23%
- Value pricing creates resilience in all environments
- e.l.f. Cosmetics → ~$7.50
- Top Mass Brands → ~$9.50
- Prestige Brands → ~$30
- Dominant brand with younger generations
- #1 Cosmetics brand for Gen Alpha, Gen Z, Millennials
- Market share gains vs competitors
- Top 10 cosmetics brands 5-year market share change → -30BPS
- e.l.f. 5-year market share change → +800BPS
- Strong brand popularity and cultural relevance
- e.l.f. popularity in US increased from 31% at the end of 2020 to 42% at the beginning of 2025
- Market assumes growth will decelerate too significantly
- Growth has been exceptionally high, leading investors to expect natural mean reversion
- Perception that beauty is a mature, low-growth category
- Belief that competition will erode share gains over time → Reality e.l.f. continues to gain share (+800bps over 5 years)
Source: e.l.f. Beauty, Inc., 2026; Statista
- •e.l.f. Beauty, Inc. (2025). Form 10-K for the fiscal year ended March 31, 2025. U.S. Securities and Exchange Commission.https://otp.tools.investis.com/clients/us/elf_cosmetics_inc3/SEC/sec-show.aspx?Type=html&FilingId=18506575&CIK=0001600033&Index=10000
- •e.l.f. Beauty, Inc.. (2024, September 5). Press release.https://investor.elfbeauty.com/stock-and-financial/press-releases/landing-news/2024/09-05-2024-050115418
- •e.l.f. Beauty, Inc.. (2025, May 15). Press release.https://investor.elfbeauty.com/stock-and-financial/press-releases/landing-news/2025/05-15-2025-050108808
- •e.l.f. Beauty, Inc. (2026, February). CAGNY 2026 conference presentation.https://staticcontents.investis.com/media/e/elfcosmetics/cagny-2026-presentation.pdf
- •e.l.f. Beauty, Inc.. (2026, February 4). Press release.https://investor.elfbeauty.com/stock-and-financial/press-releases/landing-news/2026/02-04-2026-210532062
- •e.l.f. Beauty, Inc.. (n.d.). Official website.https://www.elfbeauty.com/
- •CommerceNext. (n.d.). How e.l.f. Beauty shakes up the beauty industry with bold campaigns.https://community.commercenext.com/how-e-l-f-beauty-shakes-up-the-beauty-industry-with-bold-campaigns/
- •CompaniesMarketCap. (n.d.). L'Oréal operating margin.https://companiesmarketcap.com/l-oreal/operating-margin/
- •FinanceCharts. (n.d.). e.l.f. Beauty cash flow: Repurchase of capital stock.https://www.financecharts.com/stocks/ELF/cash-flow/repurchase-of-capital-stock
- •FinanceCharts. (n.d.). e.l.f. Beauty EV/EBITDA.https://www.financecharts.com/stocks/ELF/value/ev-to-ebitda
- •Yahoo Finance. (n.d.). e.l.f. Beauty, Inc. (ELF).https://finance.yahoo.com/quote/ELF/
- •GuruFocus. (n.d.). e.l.f. Beauty (ELF) enterprise value to EBITDA
- •GuruFocus. (n.d.). Decoding e.l.f. Beauty Inc.: A strategic SWOT insight.https://www.gurufocus.com/news/2899869/decoding-elf-beauty-inc-elf-a-strategic-swot-insight
- •GuruFocus. (n.d.). e.l.f. Beauty ownership.https://www.gurufocus.com/stock/ELF/ownership
- •GuruFocus. (n.d.). Gross margin for L'Oréal.https://www.gurufocus.com/term/gross-margin/LRLCY
- •GuruFocus. (n.d.). Net margin for L'Oréal.https://www.gurufocus.com/term/net-margin/LRLCY
- •GuruFocus. (n.d.). Return on invested capital (ROIC) for e.l.f. Beauty.https://www.gurufocus.com/term/roic/ELF
- •Macrotrends. (n.d.). e.l.f. Beauty P/E ratio.https://www.macrotrends.net/stocks/charts/ELF/elf-beauty/pe-ratio
- •Macrotrends. (n.d.). e.l.f. Beauty EBITDA margin.https://www.macrotrends.net/stocks/charts/ELF/elf-beauty/ebitda-margin
- •Macrotrends. (n.d.). e.l.f. Beauty free cash flow 2015–2025
- •Macrotrends. (n.d.). Estée Lauder operating margin.https://www.macrotrends.net/stocks/charts/EL/estee-lauder/operating-margin
- •Macrotrends. (n.d.). Coty operating margin.https://www.macrotrends.net/stocks/charts/COTY/coty/operating-margin
- •Macrotrends. (n.d.). Coty profit margins.https://www.macrotrends.net/stocks/charts/COTY/coty/profit-margins
- •Statista. (n.d.). e.l.f. sales worldwide by distribution channel.https://www.statista.com/statistics/753630/elf-sales-worldwide-by-distribution-channel/
- •Statista. (n.d.). Leading cosmetics brands among Gen Z in the U.S.https://www.statista.com/statistics/1293797/leading-cosmetics-brands-among-gen-z-in-the-us/
- •Statista. (n.d.). Skin care market revenue worldwide.https://www.statista.com/forecasts/1268473/worldwide-revenue-skin-care-market/
- •Statista. (n.d.). Cosmetics market revenue by segment worldwide.https://www.statista.com/forecasts/1272313/worldwide-revenue-cosmetics-market-by-segment/
- •Statista. (n.d.). Leading beauty companies by market cap.https://www.statista.com/statistics/1346623/leading-cosmetics-and-beauty-companies-worldwide-based-on-market-cap/
- •Statista. (n.d.). Beauty & personal care market outlook.https://www.statista.com/outlook/cmo/beauty-personal-care/worldwide
- •Statista. (n.d.). Popularity of e.l.f. Cosmetics in the U.S.https://www.statista.com/statistics/1361945/popularity-of-elf-cosmetics-in-the-us/
- •Investis. (n.d.). e.l.f. Beauty CAGNY 2026 presentation.https://staticcontents.investis.com/media/e/elfcosmetics/cagny-2026-presentation.pdf
- •YouTube. (n.d.). Video.https://www.youtube.com/watch?v=V3rZgB4YVnE
- •OpenAI. (2026). ChatGPT response to finance workforce question (April 9, 2026).https://chat.openai.com